March 6, 2023
Back Testing With Different PPO Settings (Percentage Price Oscillator Settings).
Using Microsoft Excel for Trading
The PPO, or Percentage Price Oscillator is a Momentum Oscillator, which compares one moving average to another and calculates values that are similar to the MACD (Moving Average Convergence/Divergence indicator).
The values obtained are percentages, which makes it useful for comparing different types of markets. We are using the emini-S&P 35 minute prices (12 bars a day) for our calculations.
Formula and Calculation for the Percentage Price Oscillator (PPO)
Use the following formula to calculate the relationship between two moving averages for a holding.
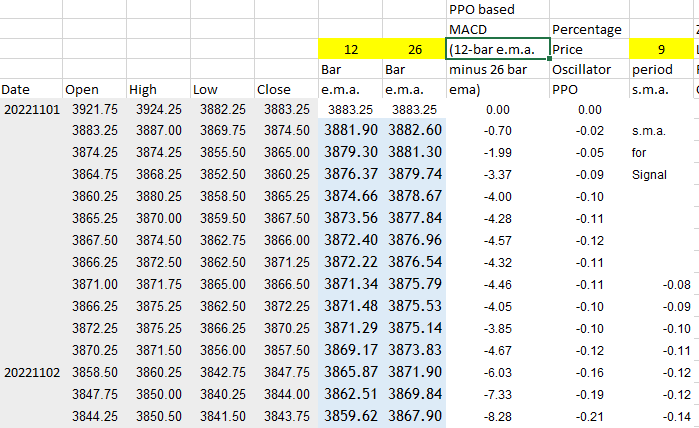
PPO=(12-period EMA−26-period EMA26-period EMA) ×100.
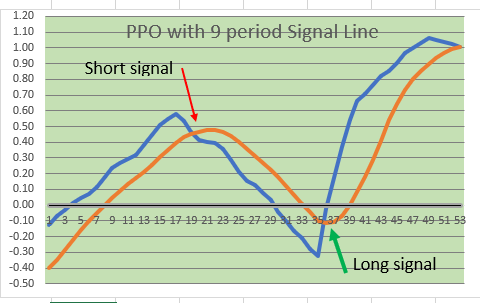
Signal Line=9-period EMA of PPO.
PPO Histogram= PPO−Signal Line.
- Calculate the 12-period EMA of the asset’s price.
- Calculate the 26-period EMA of the asset’s price.
- Apply these to the PPO formula:
- PPO line: (12-bar EMA – 26-bar EMA) / 26-bar EMA * 100 to get the current PPO value.
- Once you have at least nine PPO values, make the signal line by calculating the nine-period S.M.A. or EMA of the PPO Line.
- Use the Crossover of the Signal Line and the PPO Line for your “go LONG” or “go SHORT” activity on your Excel Worsheet and Chart.
Here is a SNIPPET (Clipping) from a section of our downloadable spreadsheet which you can get at the bottom of this blog post:
WE USE THE CROSSOVER OF THE PPO Calculation with the SIGNAL LINE TO SIGNAL “LONG” or “SHORT” ENTRIES. Some traders like to use the zero line for signals, but we do not.
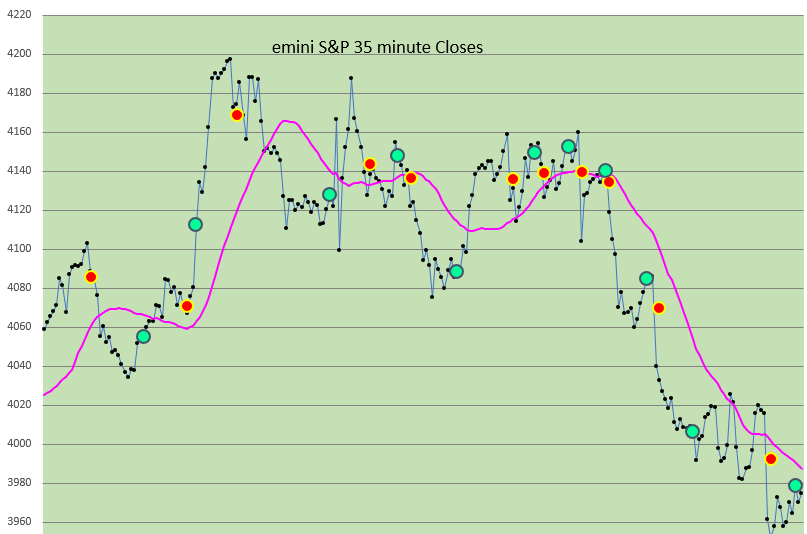
FROM THE SPREADSHEET: Here is what a longer term chart looks like: (Red dots mean “Go Short”, and Green Dots mean “Go Long”……A 29 period simple moving average of the Close is included.
IN THE FREE SPREADSHEET (DOWNLOAD BELOW):
WE COMPARE FOUR (4) DIFFERENT SETTINGS FOR THE PPO (Percentage Price Oscillator) Calculations, and show FOUR (4) DIFFERENT CHARTS. One Setting is particularly good, and it is very near to the standard values of 12 and 26 as settings.
REMEMBER, WHATEVER RESULTS SHOW UP DURING THIS TESTING PERIOD MAY NOT BE AN INDICATION OF SIMILAR RESULTS FROM EARLIER TESTING PERIODS OR FUTURE TESTING PERIODS. THERE IS RISK IN ASSUMING THAT THIS STRATEGY IS RELIABLE OR PROFITABLE BASED UPON THIS SHORT TIME PERIOD IN THE SPREADSHEET. USE IT FOR EDUCATIONAL PURPOSES ONLY.
YOU CAN SEE WHERE on a chart THE TRADES ARE INDICATED (By the bright Green or bright Red Dots (not the same thing as Trend Strength Dots)).
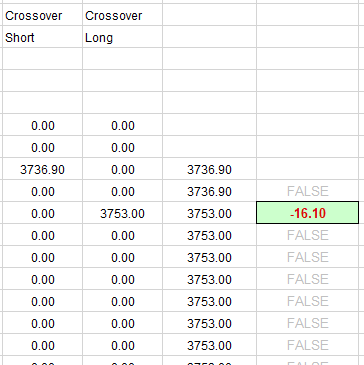
WE ALSO INCLUDE A TRADE Analysis AND PROFIT/ (LOSS) ANALYSIS FOR EACH SETTING, so that you may evaluate the Performance Statistics of each PPO MACD setting.
ALL PPO MACD SETTINGS ARE ADJUSTABLE. ALL STARTING EQUITY SETTINGS ARE ADJUSTABLE.
Here is a snippet of what an typical report includes:

Spreadsheet also includes Trade by Trade results, Like this:

Please Note: THE TRADING STRATEGY IS A LONG OR SHORT REVERSAL STRATEGY, WITH NO STOPS, NO EXITS, AND SERVES AS A BEGINNING SPREADSHEET FOR THOSE WHO ARE INTERESTED IN ANALYSIS, STATISTICS, AND TRADING PERFORMANCE SET UP.
We hope that you find Back Testing W Percentage Price Oscillator (PPO) useful, and can include it in your took kit while trading with Microsoft Excel.
Good Luck With your Trading!
PPO For Back Testing Download is below.
Excel Spreadsheet DOWNLOAD HERE:

You must be logged in to post a comment.