USE VAMI for comparing systems

December 22, 2021

Excel and trading, (free MS Excel template is available BELOW).

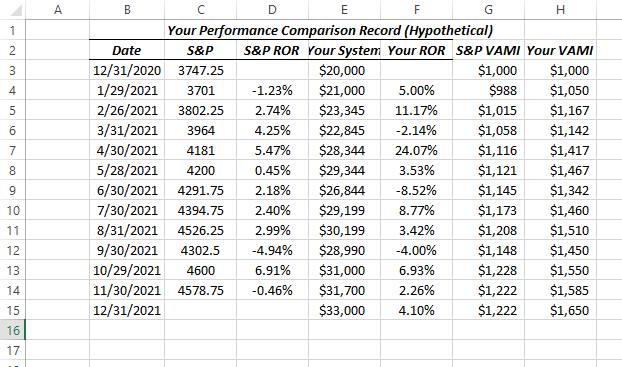
VALUE ADDED MONTHLY INDEX (VAMI) (When to Use it?):   When you have different trading systems and you want to compare their performance, or if you have different versions of one system and you want to compare them, it is useful to normalize the monthly returns and then compare them with VAMI calculations.   Or, you can compare your results on a monthly basis with the performance of the emini S&P (or any other tradeable).

This way, when you are finished, you can compare apples to apples, rather than apples to oranges.   With VAMI results you can evaluate the 2 sets of performance results.

Here is an example that compares the S&P to a hypothetical trading system:

Which has performed better?


VAMI 1 pic

Here is the excel demonstration file for download (no VBA, no macros).

VAMI with formulas     <—DOWNLOAD HERE

Remember, there are many other ways to compare trading system results, such as cumulative equity comparisons,  Sharpe ratio comparisons, Gain-To-Pain ratios comparison, Tharpe system performance metrics, etc., etc.

Using VAMI is a good place to start, and so here are the calculations in Excel.

Good luck with your trading!

therivertradingsystem@gmail.com

Excel Trading System using End of Day Price Data

Trading With Excel spreadsheet and eSignal price data.  

December 18, 2021 

To show educationally How you might use Excel spreadsheet to calculate entry targets, losses and gains, including stop loss exits, and profit exits, monthly P/(L), and much, much more!

eminiways.com

Method:  Using two (2) simple moving averages and R.S.I. as a filter. 

Purpose: To show educationally How you might use Excel to calculate entry targets, losses and gains, including stop loss exits, and profit exits, monthly P/(L), and much, much more!  All Formulas are shown and A TEMPLATE (COMPLETE TRADING SYSTEM) IS INCLUDED FOR YOUR STUDY AND EDUCATION only).


image

BONUS !  !  BONUS!  !   Swing Line chart and calculations for making a swing line chart with Excel included ! ! 

image


HERE IS THE DOWNLOAD of THE MS EXCEL Spreadsheet (no VBA, no macros):

contact us at:

therivertradingsystem@gmail.com

What is the E-Mini Trend Today?

Trading with Microsoft Excel (Using 35 minute data or 12 bars a day).

End of Day January 7, 2022

The Daryl Guppy Multiple Moving Averages (GMMAs) give us a first look at the trend today.

GMMA jan 7 2022

At the far right above, the red dots (downward momentum) are BELOW the blue lines and BELOW the red lines, meaning an DOWNWARD TREND.

BELOW:  Another example of a trend indicator that we use is the 29 bar s.m.a. of the close (red line below) .  The second red line is the same moving average but smoothed.

The Army Green below is the Halfway Line (half way between the 3 day High and the 3 day Low).   It is shown with the 29 period s.m.a. of the close and its smoothed self both as red lines.  The Halfway line is an excellent trend indicator, and is a good trade signal as well.  We use it along with the 2 red lines as enhanced trend indication!

halfway Jan 7, 2022

Lastly, we present (below) a bit more complicated chart, which uses EMA Waves (exponential moving averages of the High, Low, and Close).  We use the 29 period e.m.a. of the High, Low and Close as our default.  (Raghee Horner, who originated these, uses the 34 e.m.a. of the High, Low, and Close.)

Please see our POST about the EMA Wave (with free Excel download) in the archives.

EMA wave Jan 7, 2022

Please see our Post about EMA Waves in our Archives.   There is a free download of a macro-free, no VBA Excel Spreadsheet available also.

SO, WHAT IS THE EMINI  TREND TODAY?

CONCLUSION: the trend is DOWN at the end of the Day, January 7, 2022.

As you can see, we have found that using Microsoft Excel is accurate, fun, and profitable!   We hope you enjoy our colorful charts, which make VISUAL TRADING so much easier.

Good luck with your trading!

contact us at:

therivertradingsystem@gmail.com