Heiken Ashi for Trend Direction with Excel

Using Microsoft Excel as a Primary Trading Tool

We use the Heiken Ashi for trend direction, with Excel calculations, because Emini trading requires new ways of looking at price information, and that’s what Heiken Ashi does.     Using a Heiken Ashi formulation for your price bars will help to diminish much of the “noise” or volatility that you would see with normal Open, High, Low, Close bars.

This is one way to determine the market direction or trend.   (Remember, we are short/medium term trend traders, using intra-day 35 Minute price bars, which means we trade often but are not day-traders.)

Here are directions for setting up an Excel example yourself:                                                               (the actual Excel file is at the end, to download).  

Heiken Ashi will be abbreviated to HA from now on.  In Excel, start with 5 columns, Col A, Col B, Col C, Col D, Col E, in which you place your normal Date, Open, High, Low, and Close values.  Then, in the next 5 columns to the right, Col F,Col G, Col H, Col I, Col J, create your HA formulations to create Heiken Ashi bars in this manner, specifically as HA Open, HA High, HA Low, HA Close, and Pivot HA.

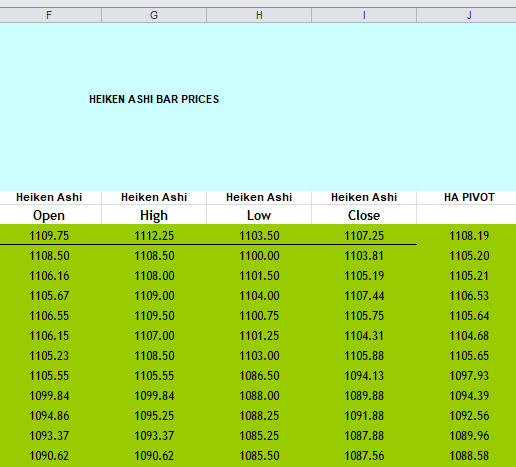
The first (topmost) HA row (in Col F, Col G, Col H, Col I, Col J) is the same as the normal Open, High, Low, and Close.

Below that, in the second HA row, Start with the HA Close, in Column I, calculated as  (Open + High + Low + Close)/4

Col F:   HA Open=(PreviousHAOpen + Previous HA Close)/2

Col G: HA High = MAX(High, HA Open, HA Close)

Col H: HA Low = MIN(Low, HA Open, HA Close)

Col I: HA Close = (Open + High + Low + Close)/4

Col J: Pivot HA = (HA Open + HA High + HA Low + HA Close)/4

Your first goal is to arrive at HA price bar values and then calculate the Pivot HA.  With the Pivot HA, the second goal becomes the calculation of moving averages of the Pivot.  This gives you your primary “long”, or primary “short” direction signal.  This is how you can determine your Directional Bias.

We prefer using 2 moving averages of the Pivot HA as a crossover to determine Primary Trade Direction.

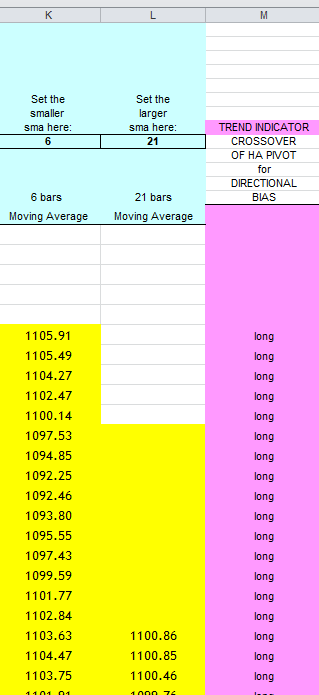
Column M (above) is your TREND DIRECTION.

Remember, we use 12-bars-a-day (35 Minute bars), and this method of finding the trend can be the basis of your Primary Trend Direction trades.

Here is an Excel file which demonstrates (no macros, no VBA):

WANT TO SMOOTH YOUR HEIKEN ASHI with Excel? See our Sept. 2022 post.

Please see our archives for more free downloads of OTHER METHODS OF TREND DETECTION, such as DOUBLE SMOOTHING YOUR HEIKEN ASHI, how to create EMA WAVES, and how to create KAMA (Kaufmann’s Adaptive Moving Average). These are also good ways to detect and follow trends.

and Good Luck with your trading!

contact us at:

therivertradingsystem@gmail.com

How to evaluate your trading system- elementary

How to evaluate a trading system and its performance.

Here is a simple Excel spreadsheet which demonstrates the most basic statistical calculations for Trading Performance evaluation.   It is a good place to start, but only tells you the most elemental of facts……whether or not you have a usable trading system.

Excel example here……….(no macros, no VBA)

Next, here is an evaluation spreadsheet in Excel, which is more detailed than the previous one: It is a trade evaluation, part 2: ……(no macros, no VBA).

Here is what is demonstrated in the spreadsheet example……

Note:  ABS means absolute value or positive value of.

Trades…a list of trades in points, to use in the calculations.

Number of Trades… you can’t get a meaningful analysis of a trading strategy unless you have approximately 30 trades.   Minimum.

Average Winning Trade (Sum of all positive trades/#of positive trades)

Average Loss  (Add up all your losing trades and divide them by total number of losing trades)

Win Percent = # winning trades/ total # of trades.  We believe that the higher win percents are the best, but many useful trading systems have win percents below 50%, most notably the Turtles type long-term trend followers.    All of our systems trade in the win percent of 60% +, and we use strategic exits to ensure even higher win percent (such as Maximum Favorable Excursion exits).

Profit Factor (PF) = (sum of all winning trades/ ABS(sum of all losing trades)).   We look for the highest numbers here, since anything over 1.00 is desireable, but in our experience 1.5 and higher indicates a better system.    We prefer to use the Pessimistic Return Ratio (PRR) rather than the Profit Factor (PF), as it weighs the number of trades as well (which the PF doesn’t).  Please see our Pessimistic Return Ratio post.

Payoff Ratio (also called Win/ Loss Ratio) = Avg Win/ ABS(Avg Loss)

Performance Ratio (from Sunny Harris) = (Payoff Ratio * Profit Factor)* Win Percent.  The Performance Ratio (called the CPC, or Cardinal Profitability Constructs now by its author, Sunny Harris),  is a simple way of telling if you  have a workable system at the beginning of development.  If it is not over 1.20, then you don’t have a usable system.   Note:  most good systems have much higher numbers than 1.20.   So, in our opinion, Performance Ratio is a very low threshold to overcome and we still use it because it was of benefit to us at an earlier point in time.

Drawdown:  this metric was not covered in the Excel demonstration.  It is not included in the spreadsheet above.  But we always follow and calculate drawdown (by which we mean closed trade drawdown) in our spreadsheets, for each trading system/ strategy.  You should also.

Expectation or Expectancy = (Avg win * Win Percent)/(ABS(Avg Loss) * (1- Win Percent)).   Note: you would like to have, at the very least, a positive expectation, otherwise you’ve got a losing system.   Can you lose money with a positive expectation?  Yes, you can, but over time and with patience and persistence, you will profit.

Just as an aside, Van Tharp has a slightly different method of calculating expectation.

All of these metrics, the Win Percent, Expectation, Profit Factor, Payoff Ratio, and Performance Ratio are demonstrated in the link above, in Excel, with calculations shown.

NOTE:  All metrics for evaluating your trading strategy are important to some extent, and we may not have included ones that you like and use, too.  But there are other metrics, and each trader must begin to get a sense of which analysis tools are their favorites, and which ones are most useful to them.  This ability to hone in on which evaluation tools are the most importand and useful comes with time, and also as a result of comparing trading systems to each other.  A trading system by itself has no ranking or valuation;  its worth must be held up and compared to others, and over time!

Also, please see our Risk of Ruin post, available in the Archives. You cannot trade for any period of time without knowing this about your system.

Also, for added precision, how about a Monte Carlo simulator!   See our post!

Good luck with your trading!

contact us here:

therivertradingsystem@gmail.com

First Steps To A Winning System

eMini Trading System– First Steps– how to

Let’s take a moment to lay out a sequential description of how to build a trading system.

We will provide our own answers, and you can supplement or adjust or ignore, if you wish.  (or contact us). Our discussion comes from 20 years of exploration in this area.

CHECK LIST TO ASK YOURSELF

A.  General: choose market (we focus on ONE market to trade only, the eMini S&P).  What data provider (eSignal).  What platform (Excel).  What brokerage (Options Xpress, Interactive Brokers).

B. The System:  1.  Predictive (no), or 2.  following (yes, short to medium term trend following).

3.  Type of price data, EOD (end of day price data)?  NO.

Intraday price data ? (yes, intraday data, using 12 equal bars each full trading day of 6.75 hours (6:30 a.m. PST to 1:15 p.m. PST) (please adjust for other time zones).

(35 Minute price bars).

The practical application of these instructions for daily data collection means that you must enter price data into your spreadsheet at 7:05 a.m. PST (end of first bar time period), again at 7:40 a.m. (end of second bar time period), and then the price data from the third bar at 8:15. And so on, until knocking off at 1:15 p.m. PST.  Only 12 data collection times, with 11 of them during the trading day, and the last at or after the Close.  This can all be accomplished easily with e-Signal Interval Tabular Price data, and an Excel spreadsheet (see image above).

4.  Determine a direction-based entry signal.  

We have found, for our time frame of 35 minute price data, that a 29 period s.m.a. of the CLOSE, or a 29 period KAMA of the close, most accurately gives us a direction-based entry signal. Above is “long” and Below is “short”.

Explanation of Chart: Dark red line (ABOVE) is the 29 bar s.m.a., pale red line is its smoothed self. Orange dots are end of day closing price. This is the primary tool that we use to determine the direction of the emini S&P.

As you can see, from the example above, that this is not always simple-as-pie, right?

Please see our other posts for additional tools to use with your Excel spreadsheets.

Good luck with your trading!

contact us at:

therivertradingsystem@gmail.com