Please see our ARCHIVES

We found out a long time ago that “long term trading” (hardly different from the phrase “investing”) is not for us. We actually enjoy the trading of a shorter term viewpoint, and we also enjoy having income on a weekly and a monthly basis from our trading profits. Thus, we are medium and short term traders, (but not day traders, per se, because we hold our trades overnight and for days at at time if the conditions are right). We use the 29 period s.m.a. of the Close (or 29 period s.m.a. of KAMA) as our determination of Medium Term Trend. Since we use 35 minute bars (12 bars a day), that is almost the same as the 2 1/2 day simple moving average of the Close (which is difficult to make use of on an End of Day daily price chart).
A medium term chart of ES Z21 (December 2021 contract), for us, looks like this (from our Excel spreadsheet): from September 17, 2021 to October 15, 2021:
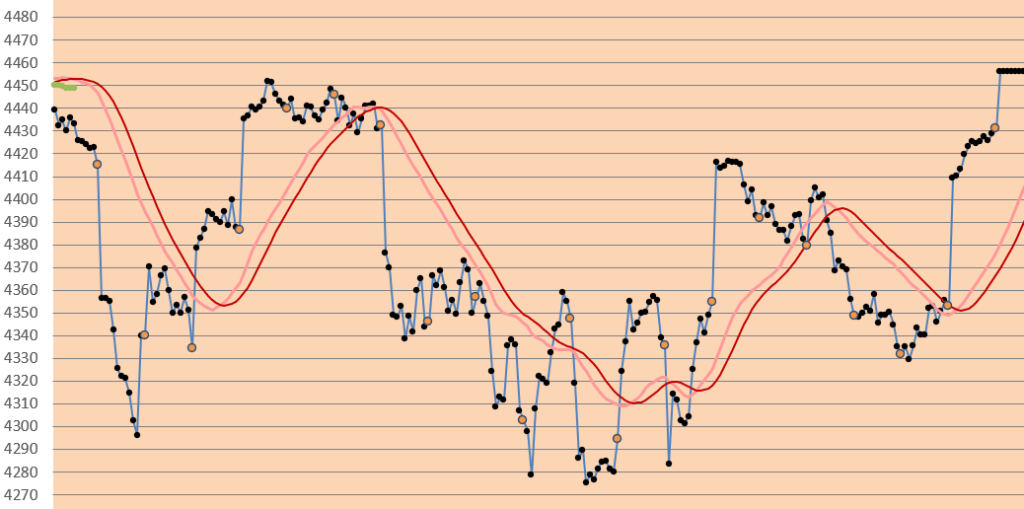
Remember, this can be a completely VISUAL SYSTEM if you want it to be. Your AIM is to trade above the 2 red lines (long), or below all two red lines (short).
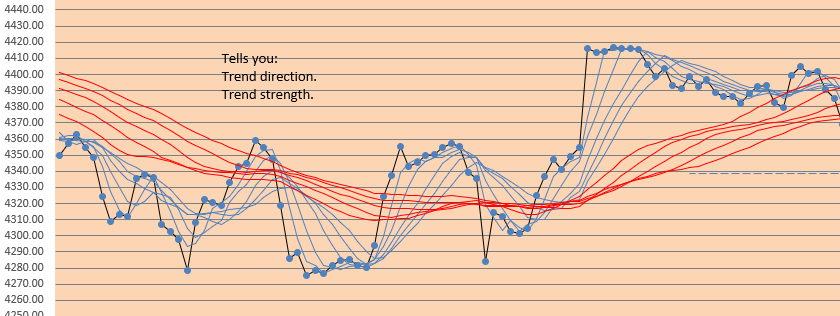
We can also use Darryl Guppy’s multiple moving averages (GMMAs) to show trend direction and trend strength. Here is an example of the GMMA from our Excel spreadsheet (not from the same time period as the above charts):
Those are the general features of our day to day Medium and Short Term outlook.
Good luck with your trading!
contact us at:
therivertradingsystem@gmail.com
Trading emini S&P, trending, 35 minute charts, entry signals, profits, and more.
Established in early 2018, “eminiways” is a blog focusing on our world of trading the emini S&P futures. Please see our ARCHIVES. We have a unique time frame, and a unique entry approach, and a superlative performance and profit history.
Latest Posts
Follow Me
Get new content delivered directly to your inbox.

You must be logged in to post a comment.