Trading with Excel Spreadsheets
December 18, 2022
Please note: this is NOT THE SAME AS CLASSICAL ICHIMOKU CHARTS.

Price data in all of these charts is from December 2, 2022 thru December 16, 2022.
We have found this to be quite reliable for trading visually, with reduced risk in trades due to the Gray Line filter, and during the trading session it is visually clear with no confusion as to when to trade and in which direction to trade.
This is a VARIATION on the “style” of Ichimoku Charts, where there is a
1. Price Line which shows Closing Prices.
2. Short term band to show possible exit areas (normally called the Tenkan Sen or Conversion Line).
3 Medium term band to show the Trade Signal (normally called the Kijun Sen or Base Line).
4. Long term band (normally called the “Cloud”), to show long term support and resistance areas, with Span A and Span B, etc.
Please study these Ichimoku related terms on other web sites and with other resources to learn more about this fascinating and VERY EFFECTIVE method of chart construction and trading.
We use different calculations and demonstrate the price action differently from a conventional Ichimoku Chart, but with many of the same instructive and conservative features that Ichimoku has.
In addition, Our VARIATION shows: The short term momentum of the Closing Prices.

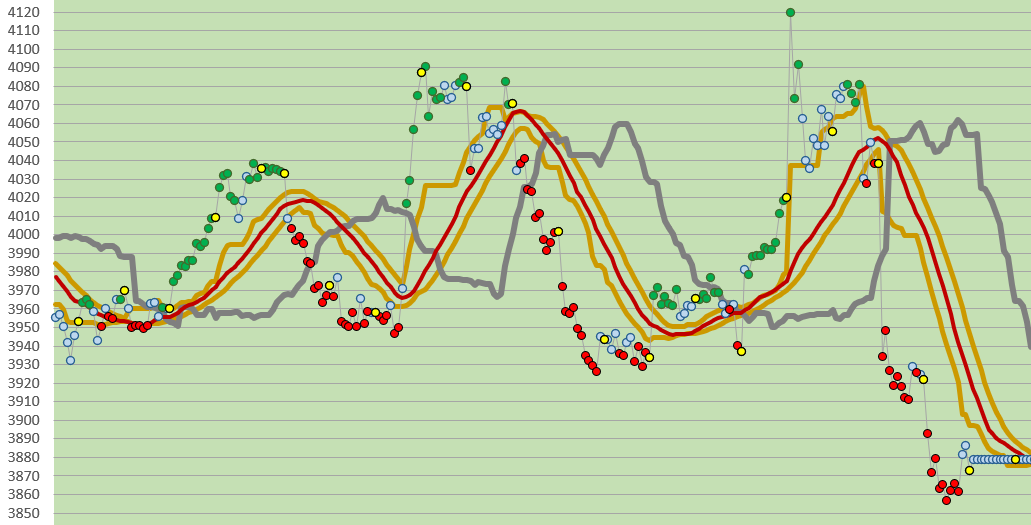
Here is how it looks in a chart:

Our VARIATION shows: A Band of 3 lines (gold and brick red lines) which is the TRADE SIGNAL Band. Above this band the price direction has a tendency to go up. Below this band, the price direction has a tendency to go down.
Our VARIATION SHOWS: A Gray Line (this line determines the overall Trend in our chart). Look to the Gray Line to tell you what the Trend is, and what the Trend has been. It acts as a Filter: If Closing price is above this line, then Long Trades are permitted. If Closing price is below this line, then Short Trades are permitted.

Here is another snippet from the larger chart above:

Because of our unique time period (35 minute bars), and our use with Microsoft Excel to create charts, we have changed the Ichimoku conventional chart into a different one. WE ARE PRESENTING A DIFFERENT TYPE OF CHART, which utilizes the concepts from Ichimoku, and which suites our needs at this time. Perhaps you will find it helpful.

Below, is a longer term view of the E-mini S&P chart from Nov 17, 2022 until Dec 16, 2022. You’ll note how closely the 29 period s.m.a. (brick red line) follows price action:
Good Luck with your trading.
Interested in having the spreadsheet? Contact us and we’ll send you a copy when you give us a small donation!
therivertradingsystem@gmail.com

You must be logged in to post a comment.