Trading with the Excel spreadsheet.
November, 2022
Nowadays we can calculate Trend Strength in a variety of ways, with the ADX, a momentum indicator calculation, or a MACD, or with any one or a variety of fast and slow oscillators, with Chande’s momentum oscillator and other methods.
Since we like a VISUAL momentum indicator to be used with our charts, we suggest and recommend the following: create Excel Trend Strength Dots (see charts below).
KNOWING THE STRENGTH OF A TREND IS THE BACKBONE OF ANY TRADING METHOD
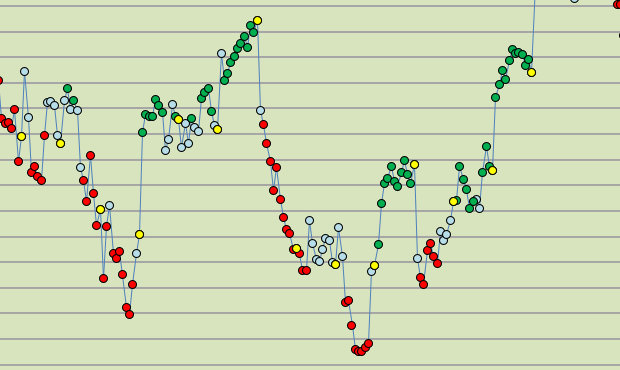
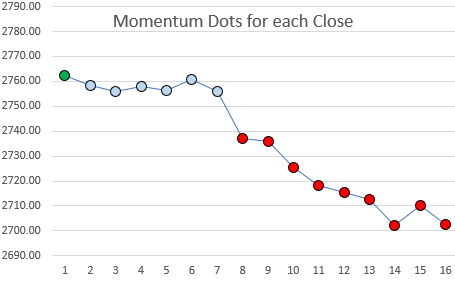
Above is a series of 35 minute closes over more than two weeks time. Each dot is a Trend Strength Dot, green for Bullish, Red for Bearish, Blue for neutral. The yellow dots are End-of-Day markers.
THEY HELP YOU EVALUATE DIRECTION AND MOMENTUM.
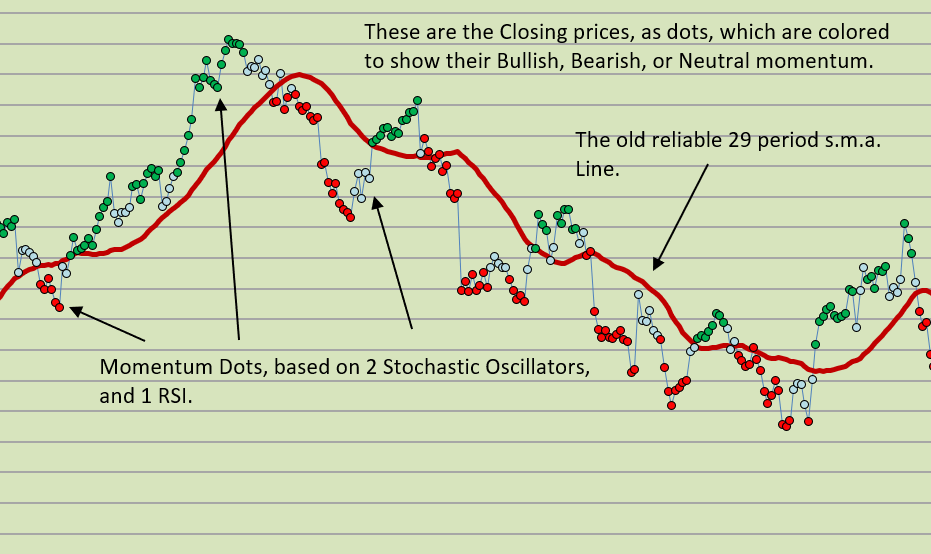
If you add a moving average of your choice, you may find the trade signals more clearly.
We have added the equivalent of a 17 and 21 bar moving average here so that you may VISUALIZE how you might trade with your Excel Spreadsheet.
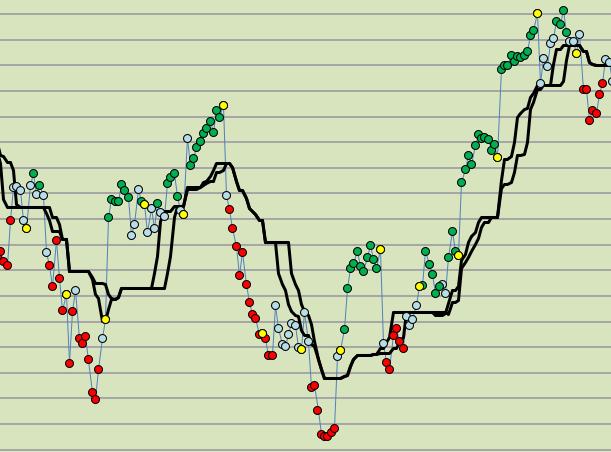
We usually exit a directional trade (red or green dots) after the dots have turned blue (because blue dots indicate a neutral trade strength, a pause, or a change in trend). If prices are near the black lines then it is an excellent time to exit.
This is how you can make these dots for yourself in your own spreadsheet: follow these directions.
Start with these steps…..
- Calculate a standard 14 period Stochastic Oscillator
- Calculate a standard 8 period Stochastic Oscillator.
- Calculate a standard RSI (relative strength index).
- Combine the data into a price chart and display it as a dot. When all 3 measurements have a value above 50, then the dots will be GREEN. When all 3 measurements have a value below 50, then the dots will be RED. Otherwise, the dots will be light blue (NEUTRAL).
(We hope to show you how to do this in our free No-VBA spreadsheet which you can download below. But it is not available at this time.)

14 bar Stochastic Oscillator which illustrates price momentum.

8 bar Stochastic Oscillator which illustrates price momentum.
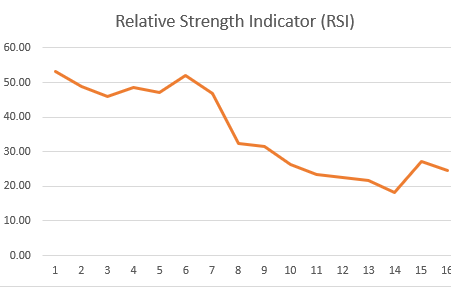
If you just construct 3 separate charts (14 period Oscillator, 8 period Oscillator, and RSI), (SEE ABOVE THREE CHARTS), how would you go about using them during a day of trading? Looking at each of them, back and forth, all day? Too difficult to use when you just have a line chart. There is an easier way, and the BEST WAY is to make Colored Momentum Dots (see how they look at the top of this page).
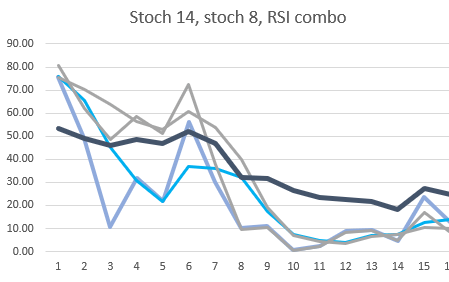
When you make a combined chart (above) which joins all 3 data sets together on a single chart, then you will have a confusing mess of 3 or more different lines, all being displayed above and below their significant reference lines. This is not easy to make use of, is it?
A creative solution is to do the following, make Trend Strength Dots, which COMBINE the two stochastic oscillators data and the RSI data and then display this on a price chart all at the same time in relation to the prices. Confused?
(Above) All three momentum measurements combined into Trend Strength Dots. The Trend Strength above went from Green (bullish), to Blue (neutral), and finally to Red (bearish).
Trend Strength Dots are a very good visual aid while trading each day.
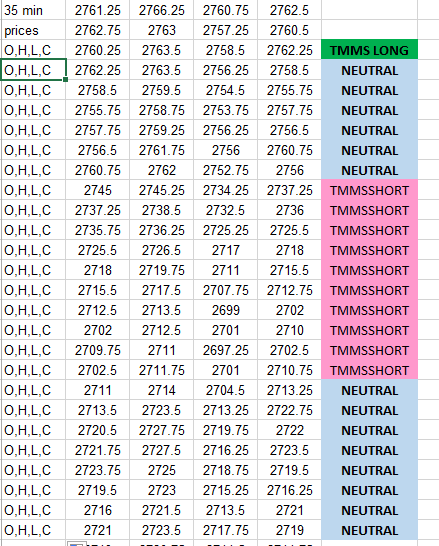
The Trend Strength dots are displayed dots on a chart of the closing prices which are colored green or red or neutral based upon their composite calculated momentum values. For instance, Green (favoring a “bullish” momentum), red when they favor a “bearish” momentum, and neutral (light blue) when they are neither bullish or bearish (“neutral”).
With additional data included, they look like this:
This is how Trend Strength (Momentum Dots) appear within your price charts in Excel spreadsheet.
A much clearer VISUAL picture of what is happening to prices over time.
You can also reference the present momentum status next to your entry prices in your spreadsheet. (Get a read-out of the current price bar’s momentum status.)
For a small donation, there is the demonstration spreadsheet available (no VBA, no macros).
(contact us and make a donation as well, and we will send you the Trend Strength Dots Excel worksheet). THESE MOMENTUM STRENGTH DOTS (Trend Strength) ARE ONE OF THE PILLARS OF OUR TRADING APPROACH!
Good luck with your trading!
therivertradingsystem@gmail.com

You must be logged in to post a comment.