May 13, 2022 Trading with Excel spreadsheet.
We have found that for our time period, which is 35 minute price data, and our method of trading, which uses the Excel spreadsheet, that the best directional trading signal is the 29 bar moving average. We have in the past used the Kaufmann Adaptive Moving Average (KAMA), the Simple Moving Average (s.m.a.), and the Exponential Moving Average (e.m.a.) and have compared them. This is what we conclude:
29 e.m.a. of Close and 29 s.m.a. of Close are the best directional trading signals (if you are using 35 minute price data). Trade OUTSIDE the lines!
In day to day use, the best directional trading signal is double moving averages, specifically two moving averages, both of which are 29 bars. The s.m.a. and the e.m.a. are different enough to provide a filter for price variance and choppiness. Here is how it looks in our typical Excel chart:

Blue dots are “neutral”. Green dots are bullish (favor an upside movement). Red dots are bearish (favor a downside movement).
Here is a chart from TODAY (May 13, 2022): see how you would trade with this Microsoft Excel chart to guide you:
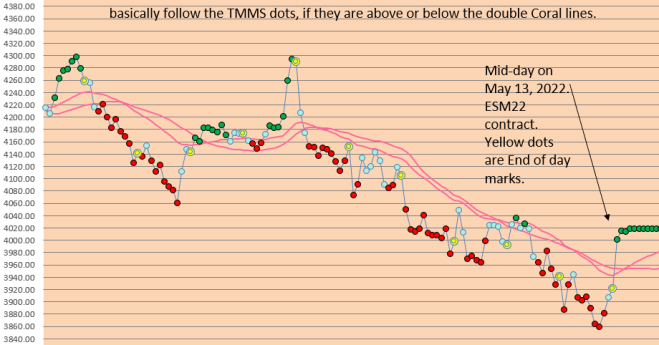
Trade Tip: Above the coral lines? Dots are Green? Then LONG.
Trade Tip: Above the coral lines? Dots are Blue? Then STAY the course, be neutral, or be “OUT”.
Trade Tip: Below the coral lines and Dots are Red? Then SHORT.
Trade Tip: Below the coral lines and Dots are Blue? Then STAY the course, be neutral, or be “OUT”.
Hint: Adding a 6 day s.m.a. or 6 day e.m.a. can help to serve as a TREND CONFIRMATION. Make your own excel spreadsheet chart and see!
See our Archives for information about how you can use Microsoft Excel spreadsheets in your trading.
Try it daily. See if it works for you! Good luck with your trading!

You must be logged in to post a comment.