Trading with 35 minute price data, and Microsoft Excel
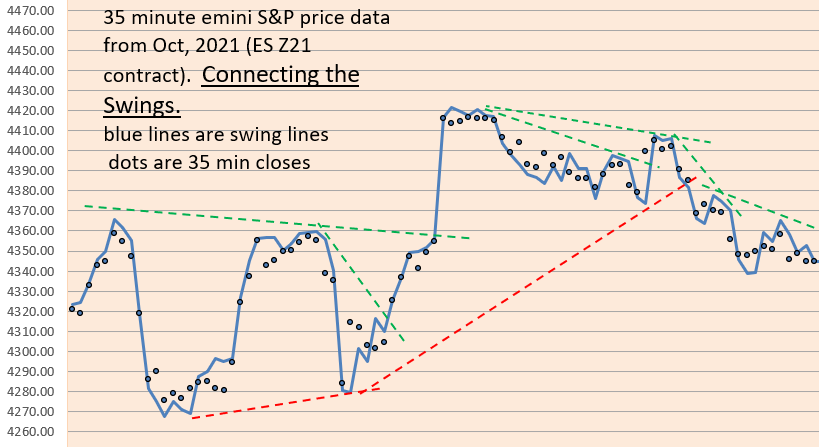
Since we are long term followers of Ira Epstein in Chicago, we thought we’d try to invent a swing line chart similar to his.
Using Excel, we have done this, and although there may be minor differences, we like these calculations so much that we have started incorporating them in our end-of-day analysis of price action.
If you wish to see how this is done in Excel, download our “example of trading system with swingline chart” in the archives.
See archives for excel demonstration of Swing Line calculations.
You can apply this to Daily Prices as well (end of day prices) with your Excel spreadsheet (see below):
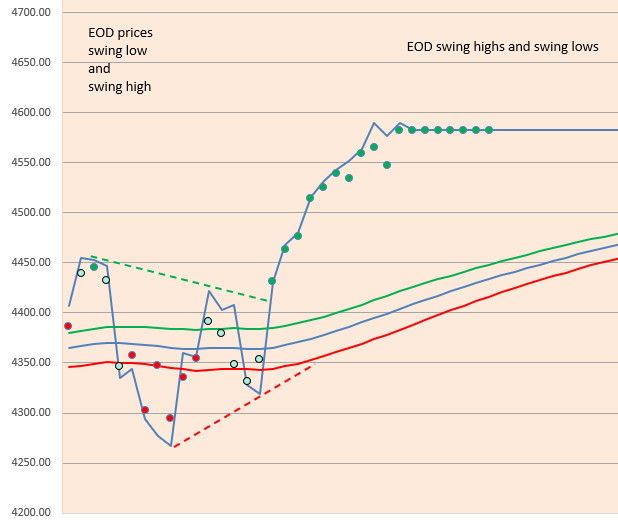
see our ARCHIVES for the post on EMA Waves (the green, blue, red lines above).
here’s the link:
https://eminiways.com/2021/10/19/ema-waves-and-grab-dots/
contact us at:
therivertradingsystem@gmail.com

You must be logged in to post a comment.